Evidence data can come in many forms. One of the most common is the color photograph. Use of color and the analysis of a photograph can be undertaken in different ways. One approach is a spatial analysis of the variation of the objects within the image, which is by far the most common approach.
Less common, and a specialty here at ACS Engineering & Safety, is the analysis of the colors themselves within the photograph. This is a more complicated endeavor. To begin with, the light being projected onto/through the object has a spectra to it. Very briefly, “spectra” means that every color corresponds to a wavelength of radiated electromagnetic waves (light). Everything we see is either reflected light from an object (such as a piece of paper), emitted light by an object (such as the Sun), or light transmitted through an object (such as the atmosphere). That light assumes a color or range of colors depending on this process. An example of emission is a picture of a fire which appears red. When the digital image is collected, it is passed to three color filters (red-green-blue) and each pixel has three versions of the space (one in each color). For the fire, you find that red dominates, which corresponds to a wavelength of light around 680 nanometers. (Side note: infrared light, which is also emitted by the fire, is at longer wavelengths and detected not with our eyes but our skin in the form of heat.) An example of reflection is a picture of blue water. When the digital image is collected, three colors filters for each pixel, the blue pixels will dominate, which corresponds to a wavelength of light around 430 nanometers. In this case, the water has absorbed the red and yellow wavelengths of sunlight, while reflecting the blue. This is why the blue water looks blue.

As shown in Figure 1, sunlight has a different spectra than a fluorescent light, so the source of the light in the photo impacts the colors detected. Next, the camera collecting the image will have color filters (see an example in Figure 2). The object being measured is reflecting/emitting/transmitting the incoming light at a different wavelengths giving it its color spectra, and the filters utilized by the camera will detect different intensities at different wavelengths. In addition to this, the output from the filters are then written into color files, commonly red-green-blue (RGB) files (see Table), and how these are read by different computer displays and printers impact the ultimate color of the object.
| Monochromatic Color | Electromagnetic Wavelength (nanometers) |
| Red | 700 |
| Green | 546.1 |
| Blue | 435.8 |
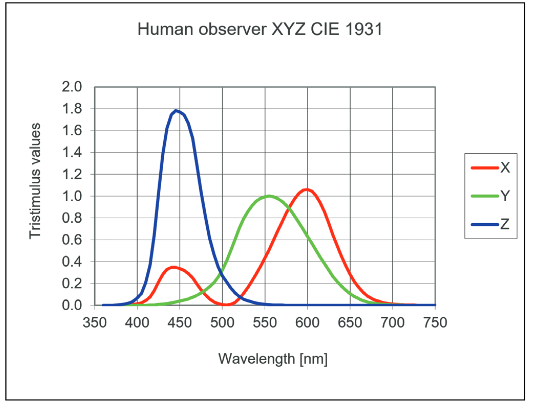
There is one more color filter to consider: the human eye (Figure 3). While image analysis involves techniques to address the previous discussion, it is important to be aware that the colors humans see similarly passes through filters, namely the color receptors in our eyes. The colors that we perceive frequently are mixes of other colors. This is something we already know with our black-magenta-yellow-cyan printers: yellow and cyan mixed together produce green. So a particular color that we see, as opposed to measure with a spectrometer, may not be a pure color at a specific wavelength. Rather it may be a blend of other colors.

https://lumileds.com/wp-content/uploads/files/WP36-spectral-pure-technology-white-paper.PDF
https://lumileds.com/wp-content/uploads/files/WP36-spectral-pure-technology-white-paper.PDF
To summarize, the analysis of the colors in a photograph is a challenging undertaking. We at ACS Engineering & Safety have special techniques and training for addressing these issues in our analyses. In one previous case for example, we confirmed local conditions were well-described by Texas A&M Forest Service maps based on two photographs taken with different cameras on different dates of the same location. At issue was that a statewide map may not be appropriate to describe the conditions in a local micro-environment where a fire had occurred.